Functions have been added to fitzRoy to plot and analyse AFL score worms
-
plot_score_worm- Plots the score difference between two teams throughout a given match. -
plot_score_worm_totals- Plots the total scores of both teams throughout a given match. -
fetch_score_worm_data- Returns score data used to plot score worms for a given match
Working with score worms
The plot_score_worm, plot_score_worm, and
plot_score_worm functions accepts the
argumentmatch_id to fetch the plot/data for a given
match.
-
match_id- the Champion Data match_id of the form CD_MSSSS014RRMM where SSSS is the Season, RR is the Round and MM is the Match. e.g. ‘CD_M20240142004’
Examples
The following are some examples of ways to plot and scrape the score worm data.
Fist we can plot the score worm for the 2024 round 20 game between Fremantle and West Coast.
plot_score_worm('CD_M20240142004') 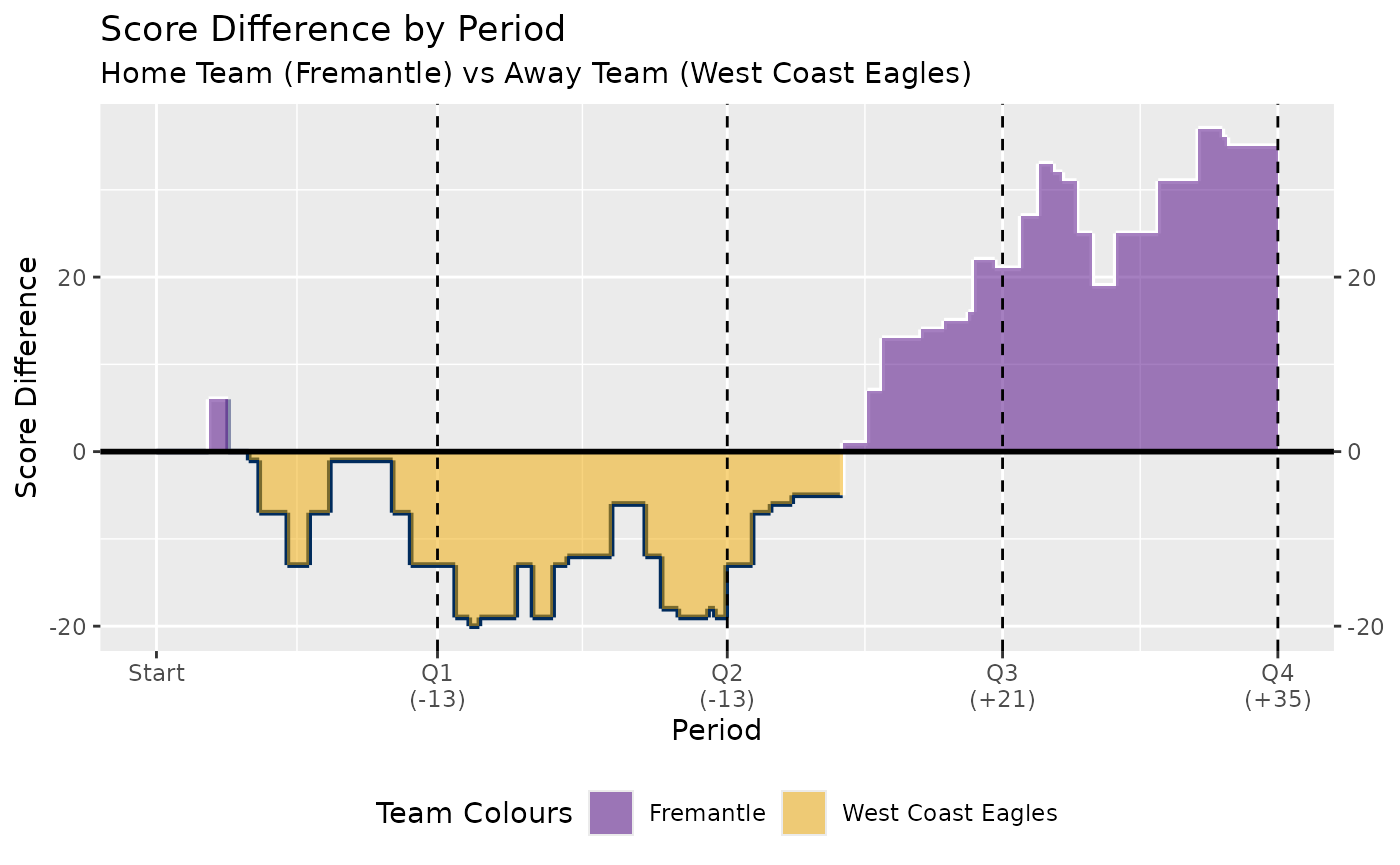
We can also plot the total scores of each team throughout the game.
plot_score_worm_totals('CD_M20240142004') 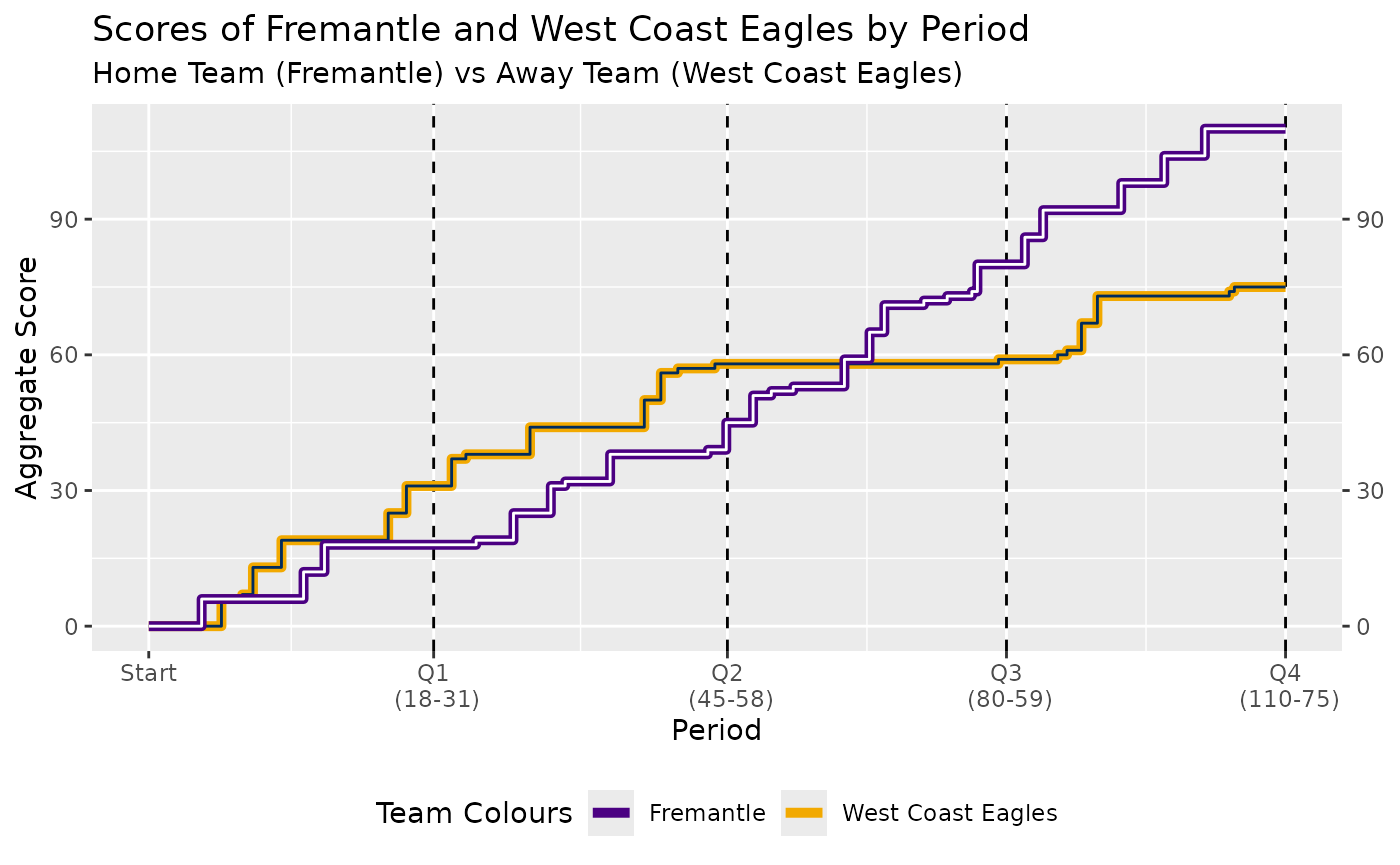
We can also just return the data for the fixture that can be used to construct these plots or for other score analysis.
fetch_score_worm_data('CD_M20240142004')
#> periodNumber TotalPeriodSeconds teamAbbr teamName teamNickname
#> 1 1 1999 <NA> <NA> <NA>
#> 2 1 1999 FRE Fremantle Freo
#> 3 1 1999 WCE West Coast Eagles Eagles
#> 4 1 1999 WCE West Coast Eagles Eagles
#> 5 1 1999 WCE West Coast Eagles Eagles
#> 6 1 1999 WCE West Coast Eagles Eagles
#> 7 1 1999 FRE Fremantle Freo
#> 8 1 1999 FRE Fremantle Freo
#> 9 1 1999 WCE West Coast Eagles Eagles
#> 10 1 1999 WCE West Coast Eagles Eagles
#> 11 2 2061 WCE West Coast Eagles Eagles
#> 12 2 2061 WCE West Coast Eagles Eagles
#> 13 2 2061 FRE Fremantle Freo
#> 14 2 2061 FRE Fremantle Freo
#> 15 2 2061 WCE West Coast Eagles Eagles
#> 16 2 2061 FRE Fremantle Freo
#> 17 2 2061 FRE Fremantle Freo
#> 18 2 2061 FRE Fremantle Freo
#> 19 2 2061 WCE West Coast Eagles Eagles
#> 20 2 2061 WCE West Coast Eagles Eagles
#> 21 2 2061 WCE West Coast Eagles Eagles
#> 22 2 2061 FRE Fremantle Freo
#> 23 2 2061 WCE West Coast Eagles Eagles
#> 24 2 2061 FRE Fremantle Freo
#> 25 3 1958 FRE Fremantle Freo
#> 26 3 1958 FRE Fremantle Freo
#> 27 3 1958 FRE Fremantle Freo
#> 28 3 1958 FRE Fremantle Freo
#> 29 3 1958 FRE Fremantle Freo
#> 30 3 1958 FRE Fremantle Freo
#> 31 3 1958 FRE Fremantle Freo
#> 32 3 1958 FRE Fremantle Freo
#> 33 3 1958 FRE Fremantle Freo
#> 34 3 1958 FRE Fremantle Freo
#> 35 3 1958 WCE West Coast Eagles Eagles
#> 36 4 1958 FRE Fremantle Freo
#> 37 4 1958 FRE Fremantle Freo
#> 38 4 1958 WCE West Coast Eagles Eagles
#> 39 4 1958 WCE West Coast Eagles Eagles
#> 40 4 1958 WCE West Coast Eagles Eagles
#> 41 4 1958 WCE West Coast Eagles Eagles
#> 42 4 1958 FRE Fremantle Freo
#> 43 4 1958 FRE Fremantle Freo
#> 44 4 1958 FRE Fremantle Freo
#> 45 4 1958 WCE West Coast Eagles Eagles
#> 46 4 1958 WCE West Coast Eagles Eagles
#> 47 4 1958 <NA> <NA> <NA>
#> teamId playerId givenName surname captain totalScore goals behinds
#> 1 <NA> <NA> <NA> <NA> NA NA NA NA
#> 2 CD_T60 CD_I1002232 Andrew Brayshaw FALSE 6 1 0
#> 3 CD_T150 CD_I1004364 Liam Ryan FALSE 6 1 0
#> 4 CD_T150 CD_I290826 Jamie Cripps FALSE 1 0 1
#> 5 CD_T150 CD_I290826 Jamie Cripps FALSE 7 1 1
#> 6 CD_T150 CD_I295898 Tim Kelly FALSE 6 1 0
#> 7 CD_T60 CD_I999321 Michael Frederick FALSE 6 1 0
#> 8 CD_T60 CD_I1020594 Jye Amiss FALSE 6 1 0
#> 9 CD_T150 CD_I1020802 Jai Culley FALSE 6 1 0
#> 10 CD_T150 CD_I1004385 Oscar Allen FALSE 6 1 0
#> 11 CD_T150 CD_I1006550 Jack Petruccelle FALSE 6 1 0
#> 12 CD_T150 <NA> <NA> <NA> NA NA NA NA
#> 13 CD_T60 CD_I1012819 Josh Treacy FALSE 1 0 1
#> 14 CD_T60 CD_I999321 Michael Frederick FALSE 12 2 0
#> 15 CD_T150 CD_I996554 Jake Waterman FALSE 6 1 0
#> 16 CD_T60 CD_I294613 Jaeger O'Meara FALSE 6 1 0
#> 17 CD_T60 CD_I999321 Michael Frederick FALSE 13 2 1
#> 18 CD_T60 CD_I1020695 Tom Emmett FALSE 6 1 0
#> 19 CD_T150 CD_I1004364 Liam Ryan FALSE 12 2 0
#> 20 CD_T150 CD_I996554 Jake Waterman FALSE 12 2 0
#> 21 CD_T150 <NA> <NA> <NA> NA NA NA NA
#> 22 CD_T60 CD_I1013611 Sam Sturt FALSE 1 0 1
#> 23 CD_T150 <NA> <NA> <NA> NA NA NA NA
#> 24 CD_T60 CD_I294613 Jaeger O'Meara FALSE 12 2 0
#> 25 CD_T60 CD_I992059 Sam Switkowski FALSE 6 1 0
#> 26 CD_T60 CD_I1020594 Jye Amiss FALSE 7 1 1
#> 27 CD_T60 CD_I1009380 Jeremy Sharp FALSE 1 0 1
#> 28 CD_T60 CD_I1012819 Josh Treacy FALSE 7 1 1
#> 29 CD_T60 CD_I999321 Michael Frederick FALSE 19 3 1
#> 30 CD_T60 CD_I1012819 Josh Treacy FALSE 13 2 1
#> 31 CD_T60 CD_I992059 Sam Switkowski FALSE 7 1 1
#> 32 CD_T60 CD_I1012819 Josh Treacy FALSE 14 2 2
#> 33 CD_T60 CD_I1002232 Andrew Brayshaw FALSE 7 1 1
#> 34 CD_T60 CD_I992059 Sam Switkowski FALSE 13 2 1
#> 35 CD_T150 CD_I290838 Jack Darling FALSE 1 0 1
#> 36 CD_T60 CD_I1012819 Josh Treacy FALSE 20 3 2
#> 37 CD_T60 CD_I1020695 Tom Emmett FALSE 12 2 0
#> 38 CD_T150 CD_I290826 Jamie Cripps FALSE 8 1 2
#> 39 CD_T150 CD_I290826 Jamie Cripps FALSE 9 1 3
#> 40 CD_T150 CD_I996554 Jake Waterman FALSE 18 3 0
#> 41 CD_T150 CD_I1020371 Jack Williams FALSE 6 1 0
#> 42 CD_T60 CD_I1020695 Tom Emmett FALSE 18 3 0
#> 43 CD_T60 CD_I1009420 Caleb Serong FALSE 6 1 0
#> 44 CD_T60 CD_I1013611 Sam Sturt FALSE 7 1 1
#> 45 CD_T150 CD_I295898 Tim Kelly FALSE 7 1 1
#> 46 CD_T150 CD_I1023492 Harley Reid FALSE 1 0 1
#> 47 <NA> <NA> <NA> <NA> NA NA NA NA
#> periodSeconds scoreType homeOrAway aggregateHomeScore aggregateAwayScore
#> 1 0 <NA> <NA> 0 0
#> 2 371 GOAL HOME 6 0
#> 3 510 GOAL AWAY 6 6
#> 4 656 BEHIND AWAY 6 7
#> 5 731 GOAL AWAY 6 13
#> 6 931 GOAL AWAY 6 19
#> 7 1086 GOAL HOME 12 19
#> 8 1233 GOAL HOME 18 19
#> 9 1680 GOAL AWAY 18 25
#> 10 1808 GOAL AWAY 18 31
#> 11 126 GOAL AWAY 18 37
#> 12 226 RUSHED_BEHIND AWAY 18 38
#> 13 298 BEHIND HOME 19 38
#> 14 560 GOAL HOME 25 38
#> 15 676 GOAL AWAY 25 44
#> 16 822 GOAL HOME 31 44
#> 17 923 BEHIND HOME 32 44
#> 18 1238 GOAL HOME 38 44
#> 19 1478 GOAL AWAY 38 50
#> 20 1594 GOAL AWAY 38 56
#> 21 1713 RUSHED_BEHIND AWAY 38 57
#> 22 1924 BEHIND HOME 39 57
#> 23 1973 RUSHED_BEHIND AWAY 39 58
#> 24 2053 GOAL HOME 45 58
#> 25 180 GOAL HOME 51 58
#> 26 308 BEHIND HOME 52 58
#> 27 462 BEHIND HOME 53 58
#> 28 821 GOAL HOME 59 58
#> 29 997 GOAL HOME 65 58
#> 30 1101 GOAL HOME 71 58
#> 31 1378 BEHIND HOME 72 58
#> 32 1542 BEHIND HOME 73 58
#> 33 1715 BEHIND HOME 74 58
#> 34 1754 GOAL HOME 80 58
#> 35 1902 BEHIND AWAY 80 59
#> 36 129 GOAL HOME 86 59
#> 37 257 GOAL HOME 92 59
#> 38 359 BEHIND AWAY 92 60
#> 39 425 BEHIND AWAY 92 61
#> 40 526 GOAL AWAY 92 67
#> 41 638 GOAL AWAY 92 73
#> 42 805 GOAL HOME 98 73
#> 43 1107 GOAL HOME 104 73
#> 44 1392 GOAL HOME 110 73
#> 45 1563 BEHIND AWAY 110 74
#> 46 1599 BEHIND AWAY 110 75
#> 47 1958 <NA> <NA> 110 75
#> scoreValue superGoals TotalPeriodSecondsVal endHomeScore endAwayScore
#> 1 NA NA 0 0 0
#> 2 6 NA 1999 18 31
#> 3 6 NA 1999 18 31
#> 4 1 NA 1999 18 31
#> 5 6 NA 1999 18 31
#> 6 6 NA 1999 18 31
#> 7 6 NA 1999 18 31
#> 8 6 NA 1999 18 31
#> 9 6 NA 1999 18 31
#> 10 6 NA 1999 18 31
#> 11 6 NA 2061 45 58
#> 12 1 NA 2061 45 58
#> 13 1 NA 2061 45 58
#> 14 6 NA 2061 45 58
#> 15 6 NA 2061 45 58
#> 16 6 NA 2061 45 58
#> 17 1 NA 2061 45 58
#> 18 6 NA 2061 45 58
#> 19 6 NA 2061 45 58
#> 20 6 NA 2061 45 58
#> 21 1 NA 2061 45 58
#> 22 1 NA 2061 45 58
#> 23 1 NA 2061 45 58
#> 24 6 NA 2061 45 58
#> 25 6 NA 1958 80 59
#> 26 1 NA 1958 80 59
#> 27 1 NA 1958 80 59
#> 28 6 NA 1958 80 59
#> 29 6 NA 1958 80 59
#> 30 6 NA 1958 80 59
#> 31 1 NA 1958 80 59
#> 32 1 NA 1958 80 59
#> 33 1 NA 1958 80 59
#> 34 6 NA 1958 80 59
#> 35 1 NA 1958 80 59
#> 36 6 NA 1958 110 75
#> 37 6 NA 1958 110 75
#> 38 1 NA 1958 110 75
#> 39 1 NA 1958 110 75
#> 40 6 NA 1958 110 75
#> 41 6 NA 1958 110 75
#> 42 6 NA 1958 110 75
#> 43 6 NA 1958 110 75
#> 44 6 NA 1958 110 75
#> 45 1 NA 1958 110 75
#> 46 1 NA 1958 110 75
#> 47 NA NA 1958 110 75
#> previousTotalPeriodSeconds cumsum_secs_start cumsum_secs_end scoreDifference
#> 1 0 0 1999 0
#> 2 0 0 1999 6
#> 3 0 0 1999 0
#> 4 0 0 1999 -1
#> 5 0 0 1999 -7
#> 6 0 0 1999 -13
#> 7 0 0 1999 -7
#> 8 0 0 1999 -1
#> 9 0 0 1999 -7
#> 10 0 0 1999 -13
#> 11 1999 1999 4060 -19
#> 12 1999 1999 4060 -20
#> 13 1999 1999 4060 -19
#> 14 1999 1999 4060 -13
#> 15 1999 1999 4060 -19
#> 16 1999 1999 4060 -13
#> 17 1999 1999 4060 -12
#> 18 1999 1999 4060 -6
#> 19 1999 1999 4060 -12
#> 20 1999 1999 4060 -18
#> 21 1999 1999 4060 -19
#> 22 1999 1999 4060 -18
#> 23 1999 1999 4060 -19
#> 24 1999 1999 4060 -13
#> 25 2061 4060 6018 -7
#> 26 2061 4060 6018 -6
#> 27 2061 4060 6018 -5
#> 28 2061 4060 6018 1
#> 29 2061 4060 6018 7
#> 30 2061 4060 6018 13
#> 31 2061 4060 6018 14
#> 32 2061 4060 6018 15
#> 33 2061 4060 6018 16
#> 34 2061 4060 6018 22
#> 35 2061 4060 6018 21
#> 36 1958 6018 7976 27
#> 37 1958 6018 7976 33
#> 38 1958 6018 7976 32
#> 39 1958 6018 7976 31
#> 40 1958 6018 7976 25
#> 41 1958 6018 7976 19
#> 42 1958 6018 7976 25
#> 43 1958 6018 7976 31
#> 44 1958 6018 7976 37
#> 45 1958 6018 7976 36
#> 46 1958 6018 7976 35
#> 47 1958 6018 7976 35
#> scoreDifference_period scoreDifferenceLabel cumulativeSeconds
#> 1 -13 -13 0
#> 2 -13 -13 371
#> 3 -13 -13 510
#> 4 -13 -13 656
#> 5 -13 -13 731
#> 6 -13 -13 931
#> 7 -13 -13 1086
#> 8 -13 -13 1233
#> 9 -13 -13 1680
#> 10 -13 -13 1808
#> 11 -13 -13 2125
#> 12 -13 -13 2225
#> 13 -13 -13 2297
#> 14 -13 -13 2559
#> 15 -13 -13 2675
#> 16 -13 -13 2821
#> 17 -13 -13 2922
#> 18 -13 -13 3237
#> 19 -13 -13 3477
#> 20 -13 -13 3593
#> 21 -13 -13 3712
#> 22 -13 -13 3923
#> 23 -13 -13 3972
#> 24 -13 -13 4052
#> 25 21 +21 4240
#> 26 21 +21 4368
#> 27 21 +21 4522
#> 28 21 +21 4881
#> 29 21 +21 5057
#> 30 21 +21 5161
#> 31 21 +21 5438
#> 32 21 +21 5602
#> 33 21 +21 5775
#> 34 21 +21 5814
#> 35 21 +21 5962
#> 36 35 +35 6147
#> 37 35 +35 6275
#> 38 35 +35 6377
#> 39 35 +35 6443
#> 40 35 +35 6544
#> 41 35 +35 6656
#> 42 35 +35 6823
#> 43 35 +35 7125
#> 44 35 +35 7410
#> 45 35 +35 7581
#> 46 35 +35 7617
#> 47 35 +35 7976
#> match_id
#> 1 CD_M20240142004
#> 2 CD_M20240142004
#> 3 CD_M20240142004
#> 4 CD_M20240142004
#> 5 CD_M20240142004
#> 6 CD_M20240142004
#> 7 CD_M20240142004
#> 8 CD_M20240142004
#> 9 CD_M20240142004
#> 10 CD_M20240142004
#> 11 CD_M20240142004
#> 12 CD_M20240142004
#> 13 CD_M20240142004
#> 14 CD_M20240142004
#> 15 CD_M20240142004
#> 16 CD_M20240142004
#> 17 CD_M20240142004
#> 18 CD_M20240142004
#> 19 CD_M20240142004
#> 20 CD_M20240142004
#> 21 CD_M20240142004
#> 22 CD_M20240142004
#> 23 CD_M20240142004
#> 24 CD_M20240142004
#> 25 CD_M20240142004
#> 26 CD_M20240142004
#> 27 CD_M20240142004
#> 28 CD_M20240142004
#> 29 CD_M20240142004
#> 30 CD_M20240142004
#> 31 CD_M20240142004
#> 32 CD_M20240142004
#> 33 CD_M20240142004
#> 34 CD_M20240142004
#> 35 CD_M20240142004
#> 36 CD_M20240142004
#> 37 CD_M20240142004
#> 38 CD_M20240142004
#> 39 CD_M20240142004
#> 40 CD_M20240142004
#> 41 CD_M20240142004
#> 42 CD_M20240142004
#> 43 CD_M20240142004
#> 44 CD_M20240142004
#> 45 CD_M20240142004
#> 46 CD_M20240142004
#> 47 CD_M20240142004We can return multiple games worth of data by passing in a vector of match_ids.
fetch_score_worm_data(c('CD_M20240142101','CD_M20240142102','CD_M20240142103'))